Core Burn: visualized progress.
Core Burn: visualized progress.
Core Burn: visualized progress.
Combating fitness stagnation by using visual data to fuel user motivation.
Role
Role
UX/UI Designer
UX/UI Designer
UX/UI Designer
Industry
Industry
Health & Fitness
Health & Fitness
Health & Fitness
Duration
Duration
3 months
3 months
3 months
Here's the problem
Here's the problem
Sustaining motivation during a fitness journey is a tale as old as time. Unfortunately, it seems that many fitness applications which aim to assist with these goals rarely make the mark.
Sustaining motivation during a fitness journey is a tale as old as time. Unfortunately, it seems that many fitness applications which aim to assist with these goals rarely make the mark.
Users are often bombarded with plain quantifiable metrics like distance, calories burned, or sets completed. This data overload can be discouraging because users lack a clear understanding of their progress. By failing to translate data into meaningful progress indicators, current apps make it difficult for users to stay motivated and see the tangible results of their efforts.
Users are often bombarded with plain quantifiable metrics like distance, calories burned, or sets completed. This data overload can be discouraging because users lack a clear understanding of their progress. By failing to translate data into meaningful progress indicators, current apps make it difficult for users to stay motivated and see the tangible results of their efforts.
This lack of clear progress visualization is a major hurdle that prevents people from achieving their fitness goals. What's missing is a mobile application that solves this by effectively transforming raw fitness data into a visually engaging and easy-to-understand format.
This lack of clear progress visualization is a major hurdle that prevents people from achieving their fitness goals. What's missing is a mobile application that solves this by effectively transforming raw fitness data into a visually engaging and easy-to-understand format.
Let's try a solution
Let's try a solution
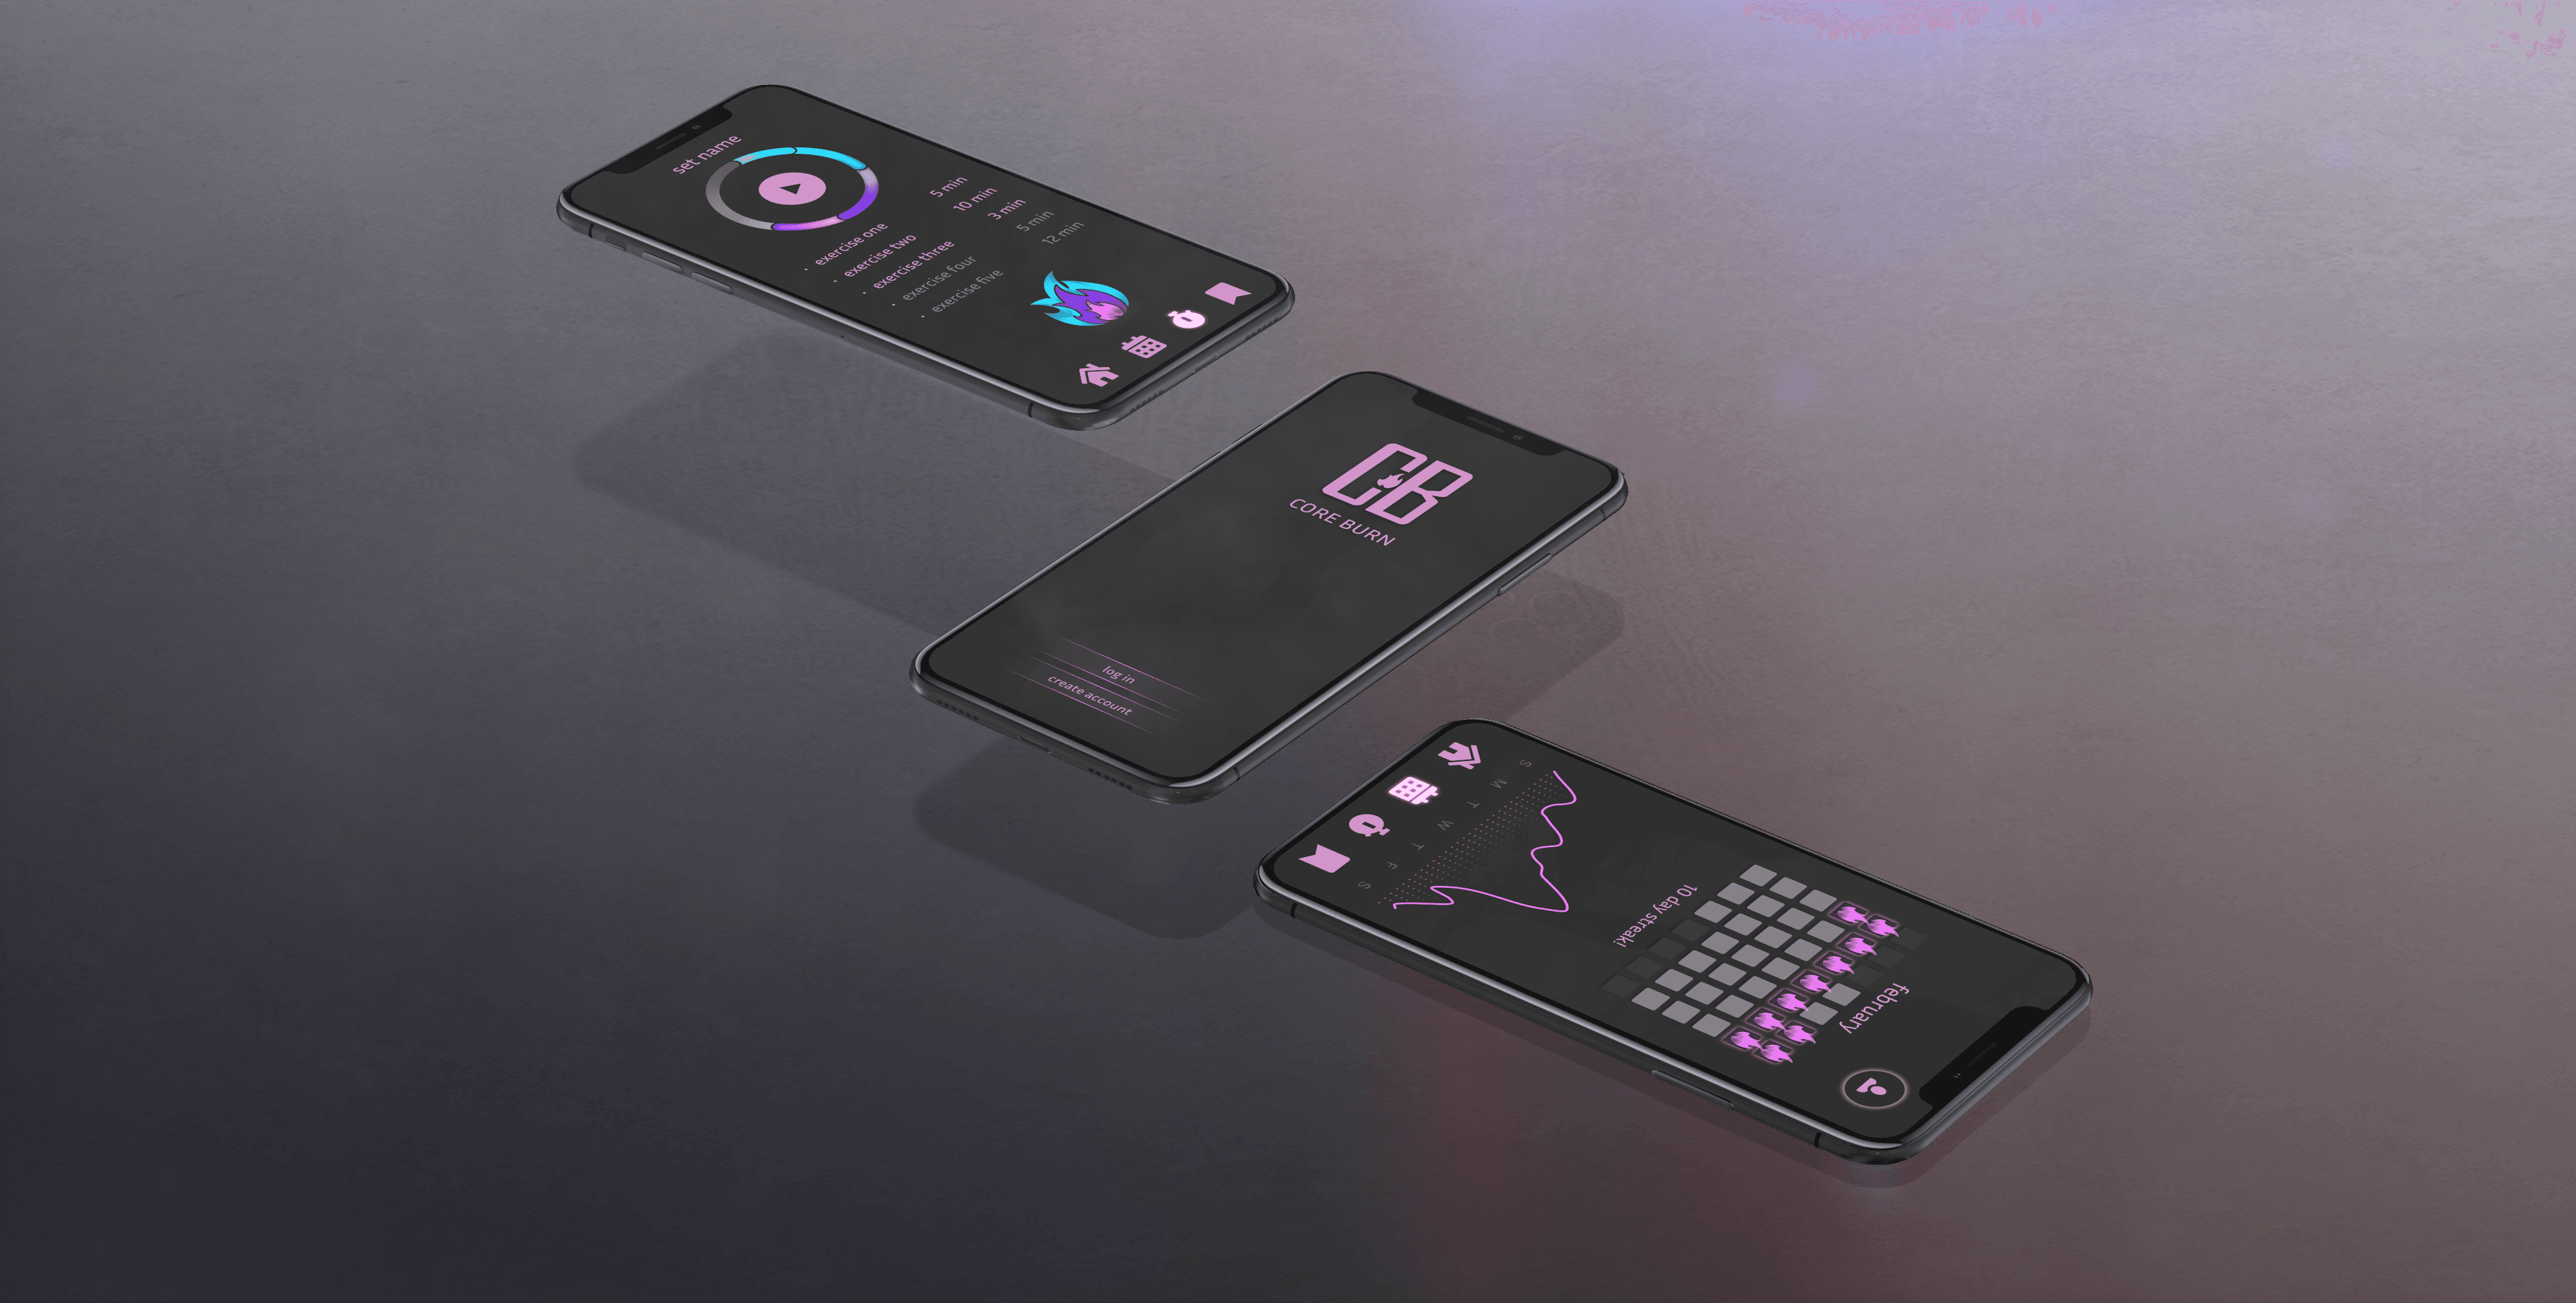
Core Burn will tackle this problem by transforming raw workout data into a user-friendly and visually compelling format.
Core Burn will tackle this problem by transforming raw workout data into a user-friendly and visually compelling format.
This mobile application will seamlessly record exercises while intelligently analyzing the information to identify trends and calculate key metrics. This data will then be translated into engaging progress charts, graphs, and personalized badges, allowing users to see their fitness journey unfold in a clear and exciting way.
This mobile application will seamlessly record exercises while intelligently analyzing the information to identify trends and calculate key metrics. This data will then be translated into engaging progress charts, graphs, and personalized badges, allowing users to see their fitness journey unfold in a clear and exciting way.
By personalizing the experience to user-defined goals and visualization preferences, Core Burn empowers individuals to stay engaged with their fitness journey.
By personalizing the experience to user-defined goals and visualization preferences, Core Burn empowers individuals to stay engaged with their fitness journey.
Uncovered Issues
Uncovered Issues

A pivotal moment in developing this application was translating user data into clear and motivating visuals. Early attempts included bar graphs, pie charts, and even leaderboards to showcase progress. However, user surveys revealed a key pain point: users cared most about their own journey, not competing with others, and found traditional graphs uninspiring. This feedback led to a shift in visualization strategy.
A pivotal moment in developing this application was translating user data into clear and motivating visuals. Early attempts included bar graphs, pie charts, and even leaderboards to showcase progress. However, user surveys revealed a key pain point: users cared most about their own journey, not competing with others, and found traditional graphs uninspiring. This feedback led to a shift in visualization strategy.
Applied Strategies
Applied Strategies

The focus moved towards personalized elements like mapping target muscle groups on an androgynous figure. Additionally, a monthly calendar with streak tracking was implemented to gamify routine building, and a weekly graph offered a more intuitive picture of daily activity trends. These user-centric visualizations resulted in a significantly more positive response, proving the power of tailored visual feedback in promoting fitness motivation.
The focus moved towards personalized elements like mapping target muscle groups on an androgynous figure. Additionally, a monthly calendar with streak tracking was implemented to gamify routine building, and a weekly graph offered a more intuitive picture of daily activity trends. These user-centric visualizations resulted in a significantly more positive response, proving the power of tailored visual feedback in promoting fitness motivation.
Impact Highlights
Impact Highlights
Comprehension
Visualizing user data allows for limitless understanding on the user's progress.
Visualizing user data allows for limitless understanding on the user's progress.
Satisfaction
Knowing where and how progress was made makes for a gratifying experience.
Knowing where and how progress was made makes for a gratifying experience.
Routine
Rewarding users with validation of their work will foster regular exercise habits.
Rewarding users with validation of their work will foster regular exercise habits.

Users largely agree that positive validation is tied with forming regular habits.
Increase in reported user satisfaction by the final iteration.
Reduced average think time in building custom gym sets between the 5th and 6th iterations.


Other Projects
Other Projects
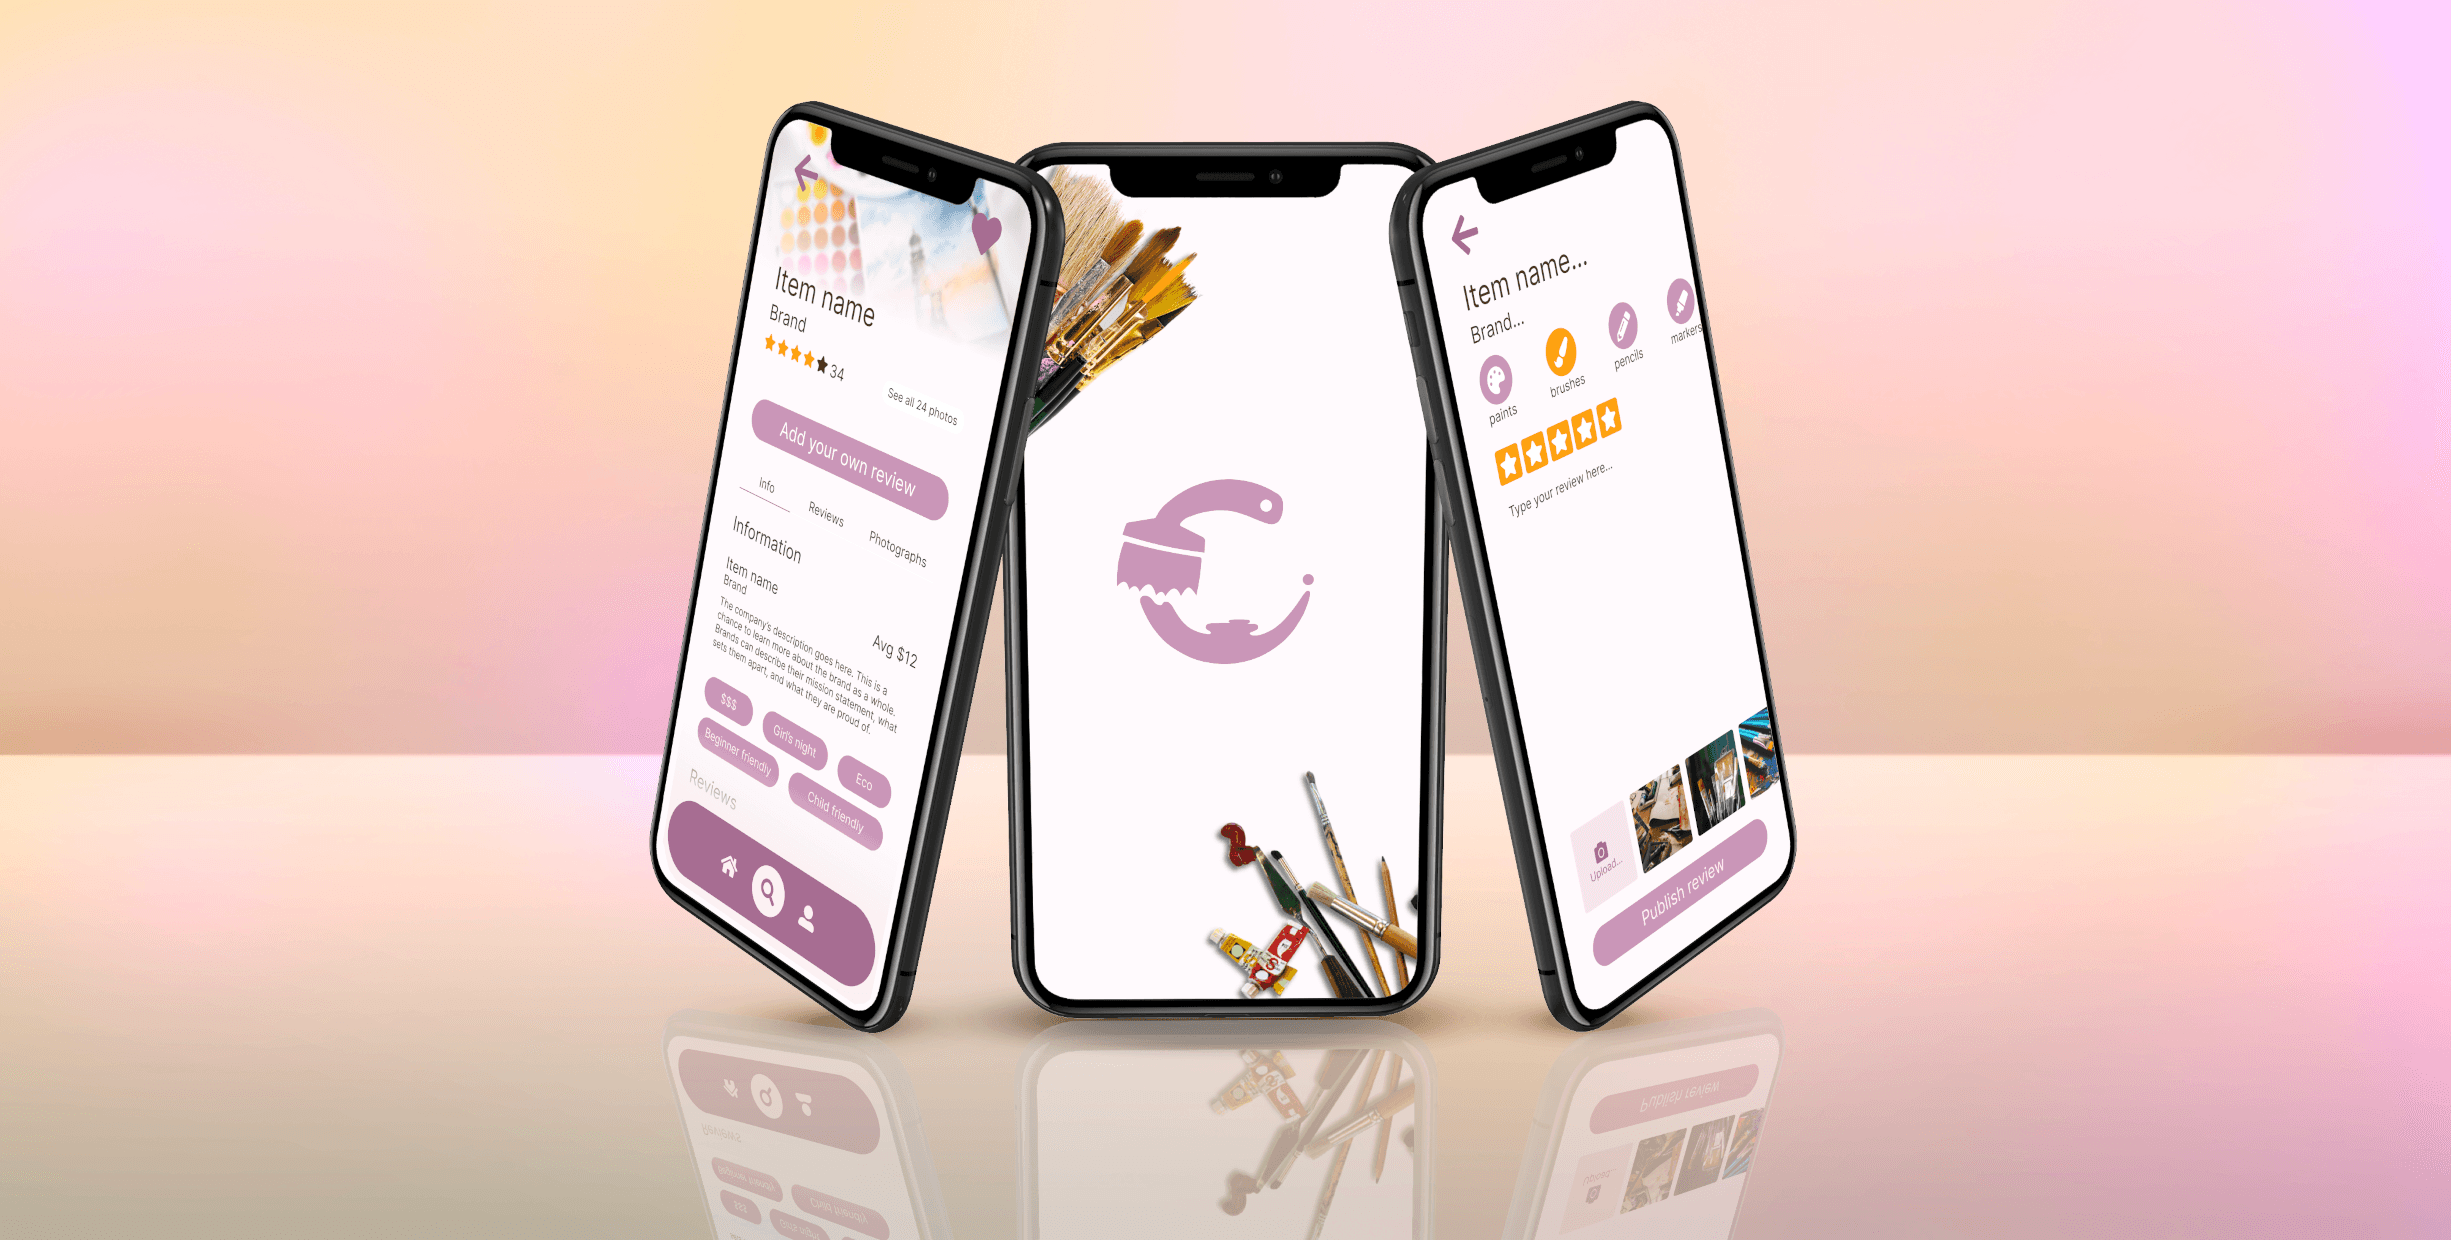
Creatique - Product Designer
Creatique - Product Designer
Everybody's a creative.
Everybody's a creative.